Supply Chain Market Research - SCMR LLC
  • Blog
  • Home
  • About us
  • Contact

Fun With Data – Panels In Pictures

1/27/2022

0 Comments


Fun With Data – Panels In Pictures
​

Now that 2021 is behind us the data for what was an unusual year in the display space becomes available and allows us to paint a picture of how the year looked, how it compared to other years, and how individual panel producers fared.  In Figure 1, we show large panel display revenue for the 2020 and 2021 years broken out by region.  China is the region with the most growth, which comes as no surprise, with revenue growing 29.4% in 2020 and 45.5% in 2021 while Korea’s display revenue declined 8.1% in 2020 and 25.0% in 2021 as both Samsung Display (pvt) and LG Display (LPL) reduced their exposure to the large panel LCD display space.  During 2020 the large panel display industry grew revenue by 5.4% and by 19.3% in 2021 and Figure 2 shows revenue share for both years.
Picture
Large Panel Display Revenue By Region - 2020 - 2021 - Source: SCMR LLC, OMDIA, Witsview, RUNTO, Company Data
Picture
- Large Panel Display Revenue Share By Region - 2020 - 2021 - Source: SCMR LLC, OMDIA, Witsview, RUNTO, Company Data
​Year over year revenue growth was a big seller for panel producers in 2021, especially when compared to weak early 2020 large panel revenue, but those comparisons declined from the high point in February as shown in Figure 3.  That said all regions save Korea saw y/y revenue growth over 25% in 2021 although declining toward year-end.  In December large panel y/y revenue growth in Taiwan was 6.2%, 4.9% in Japan, and 22.1% in China (Korea remained negative), and while the 2022 January y/y comparison might be a relatively easy one, the comparisons, especially in 1H will likely be problematic. 
Picture
Large Panel Display revenue By Region Y/Y - 2020 -2021 - Source: SCMR LLC, OMDIA, Witsview, Company Data
Looking at individual large panel providers China’s BOE (200725.CH) was the largest revenue generator in 2021, as it was for much of 2020, with LG Display the 2nd largest revenue contributor.  While LG Display was intending to reduce its exposure to the large panel LCD space in 2021, large panel price increases slowed those plans until mid-year, and while LG Display and other producers with TV panel exposure shifted production away from TV panels when TV panel pries broke in July, the overall effect of those TV panel price declines can be seen in Figure 4 as the year progressed.  In 3Q the offset to TV panel price declines was the stability (and increasing price) of IT panels, which continued to incentivize panel producers to shift more production away from TV panels and toward IT panels.  While this helped to keep the effects of TV panel price declines somewhat in check, by the 4th quarter IT panel pricing began its decline, albeit at a slower pace, but it seems the die was set as IT panel price declines continued to gain momentum, which has also been the case in January (see below).
The issue remains as to whether the IT panel price declines can be slowed by limiting utilization rates, but that takes a coordinated effort that not all panel producers will agree is the right method, and coupled with slower IT device demand, we expect it will take a few months of further price declines to make some panel producers realize that the cost of lower utilization in the short-term is less than the cost of a protracted downturn in the panel industry, especially during the seasonally slow 1st quarter.  Unless component and silicon cost increases begin to abate as overall CE demand slows, panel producers will have a difficult time passing on cost increases and will likely have to absorb much of those increases while prices decline, making for a relatively weak 1Q and possibly 1H.  If some balance can be reached before the holiday build period, there is a chance that the display space could see some growth, but display producers will likely be back to a more ‘negotiable’ mindset by the end of 1Q, which could help to lower CE device pricing and stimulate at least some demand in the 2nd half.  Still lots of unanswered questions about the CE space, but then it is still January…
Picture
Large Panel Revenue By Provider - 2021 -2022 - Source: SCMR LLC, OMDIA, Witsview, RUNTO, Company Data
0 Comments

January Panel Prices

1/27/2022

0 Comments


January Panel Prices

As we have noted previously the rapid decline in TV panel prices in 2H 2021 pushed panel producers to shift production to IT panels (Monitors, Notebooks, Tablets) where panel demand and pricing was more stable.  That shift, while reducing exposure to falling TV panel prices, tacitly increased IT panel capacity across the display industry exclusion of actual new capacity and increased the industry’s exposure to IT panel pricing.  While IT panel prices continued to rise through much of 2021 they did begin to decline, albeit far more slowly than TV panel pricing, starting in October.  While the smaller IT panel price declines were easier for panel producers to manage, their exposure was higher, giving more weight to IT price decreases, but most producers remained optimistic in 4Q, especially those who focused their IT panel production on the premium segment.
In January IT panel prices continued to decline as COVID-19 vaccination rates increased globally and a portion of the workforce returned to work, pulling demand away from stay-at-home products like notebooks and tablets.  Even with the impact of the Omicron COVID-19 variant, overall IT demand faced both waning consumer demand and expanded capacity which has led to a continuation of the IT panel price declines seen late last year. Panel price declines for all panel categories exceeded our expectations in January as shown below.  Our expectations for February panel prices continue the negative trend for all categories, and while many have expressed optimism that TV panel prices are not decline as rapidly as they have in the last few months of 2021, they are still declining and more importantly, given the expanded exposure to IT panel production, IT panel prices are falling at a faster pace than in 4Q.  1Q 2022 is typically a slow quarter for the display industry and some of that can be read into such panel price declines, but even if the global zeitgeist remains cautious about returning to a pre-COVID lifestyle, much of that stay-at-home demand seems to have been filled.
One thing we have learned about the ‘new’ CE world we live in is to expect the unexpected so we hesitate to make broad predictions about where panel pricing will be at mid-year or year-end at this early stage, but we expect this will be a more difficult year for the CE space overall as demand slows and some of the more easily resolved supply chain bottlenecks are cleared.  Hopefully this will reduce some of the price volatility that has been caused by the pandemic’s rapid shift in demand and the CE industry’s inability to manage that shift, but the global environment continues to grow more complex, or at least seems so, so we expect at least one unknown to find its way into the CE space this year.  As to whether it will be a positive or negative, we don’t know, but as Roseanne Rosaeannadanna said, “It just goes to show ya! It’s always something!”
Picture
Picture
Aggregate Monitor Panel Pricing & OC - 2019 - 2022 - Source: SCMR LLC, IHS, Company Data
Picture
Aggregate Notebook Panel Pricing & ROC - 2019 - 2022 - Source: SCMR LLC, IHS, Witsview, Company Data
Picture
Aggregate TV PAnel Pricing & ROC - 2019 - 2022 - Source: SCMR LLC, IHS, Company Data
Picture
Aggregate Tablet Panel Pricing & ROC - 2019 - 2022 - Source: SCMR LLC,IHS, Company Data
Picture
Aggregate Mobile Panel Pricing & ROC - 2019 - 2022 - Source: SCMR LLC, IHS, Witsview
0 Comments

LGD Expands?

1/20/2022

0 Comments


LGD Expands?
​

​There has been some stir in the Korean trade press about LG Display’s (LPL) plans to expand it small panel OLED capacity which we found a bit odd considering the company announced plans to do so back in August of 2021.  In our 8/17/21 note, we outlined what we expected from the $2.8b project that LG Display had indicated that would be implemented over the next 2 ½ years.  LGD did not give much detail on the plan, which could include both a greenfield fab or capacity expansion at the company’s Gen 6 OLED fabs in Paju and Gumi, with the latter being the more logical path. 
Our take at the time was for a 10,000 sheet/month expansion at E6, which had already been discussed by the company, being boosted to 15,000 sheets/month, and an additional 15,000 sheet expansion in Paju, which could change to 30,000 sheets/month as the company’s business with Apple (AAPL) improved.  The current iteration, as noted in the Korean trade press, is that LG Display is ordering as many as eight ‘exposure machines’ at a cost of over 10b won ($8.4m US), indicating that LG Display is moving ahead with its expansion plans and could double its Gen 6 capacity by 2024.
Headlines aside, LG Display has two competitors in the Apple small panel OLED display supply chain, Samsung Display (pvt) and BOE (200725.CH), with SDC the leading supplier and BOE the new entrant.  SDC continues to push toward adding technology to its existing capacity, such as LTPO (Low-Temperature Poly-Oxide), that Apple desires, while BOE is adding Gen 6 OLED capacity at a rapid rate, expecting to complete its 3rd Gen 6 small panel OLED fab this year.  While BOE is likely going to supply Apple with less sophisticated LTPS OLED panels, LGD is in that middle ground, supplying some LTPS and LTPO this year.  In order for LGD to compete with both SDC and BOE, they have little choice but to expand small panel capacity, not as much for the 2022 year, but for 2023 and 2024 when BOE could represent not only a capacity competitor but a technology competitor.
The surprise to us is that, if the trade press holds true, that it took 6 months for LGD to finalize its plans while BOE continues its expansion and SDC converts more capacity to LTPO.    Negotiations with Apple over 2023 and 2024 supply contracts and the possibility of LGD expanding its small panel OLED relationship with Apple to larger displays (tablets, laptops) could have slowed actual capital deployment, but LGD has little choice but to expand capacity if it wants to remain a competitive small panel OLED display supplier to Apple.  We do note that LGD did have to face the issue of parent LG Electronics’ (066570.KS) termination of its smartphone business, and the weakening of Huawei’s (pvt) smartphone business, but BOE is certainly moving ahead with the idea that they can be a serious contender, so there is little room for a more refined decision process.  We expect LGD made at least verbal commitments for key expansion equipment in 4Q last year as part of its expanding commitment to Apple, making the recent fury over LGD’s expansion a less important event.
0 Comments

BMW Goes Bonkers

1/6/2022

0 Comments


BMW Goes Bonkers
​

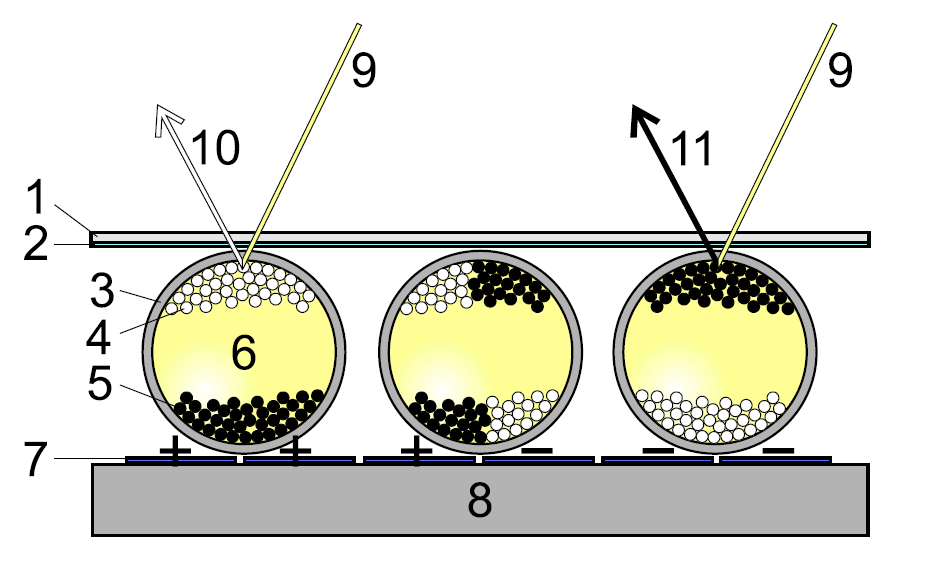
We have mentioned the use of bi-stable inks developed by E-ink (8069.TT) and popularized by E-readers and ESLs (Electronic Store labels), but BMW (BMW.GR) has come up with a use that goes far beyond those applications.  E-ink technology is based on a film that contains micro-capsules filled with a clear fluid and positively charged white particles and negatively charged black particles.  When an electric charge is applied to one side of the micro-capsule it attracts the positively charged white particles to the top of the capsule, making it appear white, and when an inverse charge is applied, it attracts the black particles to the top, making the capsule appear black, with each capsule able to be divided in half, allowing both black and white to form gray.  What makes this system most popular is the fact that once the voltage is applied, the particles remain in their last position without any power being applied, unlike most displays that need to be refreshed 60 or more times each second.  This makes such films an easy choice for battery operated devices that must last a long time before replacement.
BMW has applied this technology to the surface of a BMW iX, naming it the ‘Flow’, and while there was no mention of whether the concept would ever be applied to mass production vehicles, the demo vehicle shown at CES takes the concept to a practical level.  As shown in the video below, the finish of the vehicle is easily changed from black to white at the whim of the user, along, in this case, with the color of the rims, and while the concept was likely intended to attract considerable attention (which it seems to have done), the BMW project leader indicated that not only does it look good, but has some practical applications.  In a cold environment, changing the finish to black would allow the car to absorb as much of the sun’s rays as possible, reducing the load on the vehicles heating system, and inversely when in a bright environment, turning the shell white, would allow it to reflect much of the sun’s heat.
That said, at any time in a given parking lot there are a number of folks who can’t quite remember where they parked their car and have to wander aimlessly until they are close enough to use their key fob to flash the lights or honk the horn.  None of this would be necessary if you have the BMW iX Flow, which you can set to constantly change from black to white, making it highly visible in almost any environment, and all of this is done with almost no power consumption.  While the development of such a vehicle took years, eventually the same multi-color inks that are used in newer E-ink displays could be applied in the same way, allowing you to change the color of your car according to your mood, or even have the car do it for you by reading your facial expression (we are getting carried away here).  Again this is a concept car and may never see the light of day other than at exhibitions and demonstrations, but we have to admit its an application we had not thought of.  The link below shows the BMW demo.

youtu.be/DGFBU7CYvM0
​

Picture
E-Ink schematic - Source: E-Ink
0 Comments

Pixel Perception Problems

12/30/2021

0 Comments


Pixel Perception Problems

With the Metaverse hype moving into full swing in 2022, there will be a renewed focus on VR/AR headsets.  With the display representing the largest share of BOM for most VR devices, there are a few terms associated with what are typically called micro-displays used in such devices that are import to understand.  The first is pixel pitch, sometimes known as dot pitch, a term used to specify the distance between the center of a display pixel and the center of an adjoining pixel.  In large displays it is usually expressed in millimeters and can represent any type of pixel, such as LCD, OLED, LED, Mini-LED, Micro-LED, or ELQD, and can range anywhere from ~4mm (0.157”) for commercial (in-store) displays, to 10mm/11mm for window displays, to 25mm to 32mm for large outdoor displays. 
Picture
Pixel Pitch Representation - Source: unilumin
The concept of pixel pitch in displays would imply that the smaller the pixel pitch, the better quality the image would be, and from a technical sense that is correct, but a more realistic concept would be ‘acceptable viewing distance’, the point at which the viewer is far enough away from the display that they no longer can discern individual pixels.  However things get fuzzy (sorry) though as the viewer’s visual acuity comes into play, with a person having 20/20 vision likely to be a bit further from the display to reach that point than a person with 20/50 or greater.  This makes such calculations subjective, but the display industry has come up with a number of ways in which ‘acceptable viewing distance’ can be calculated.
  • The 10x rule says multiply the pixel pitch by 10 to get the ‘approximate viewing distance’ in feet.
  • The Visual Acuity rule says pixel pitch times 3438 gives the viewing distance in millimeters, but requires 20/20 vision
  • The Average Comfortable Viewing Distance is a subjective measure that takes into account a number of variables, such as eyesight, content type, and content resolution
Here’s what each rule gives as ‘acceptable viewing distance’ for various pixel pitches under the above rules:
Picture
As can be seen, the results vary so widely that such calculations seem either misleading or completely useless, and even as a rule of thumb, it would be hard to imagine putting much faith in brand literature that might suggest similar calculations.  Ideally the user should actually look at the display they are considering (in an actual store), starting as close to the screen as possible and stepping back until individual pixels are no longer seen, a more realistic process that would provide a better understanding of the necessity for smaller or larger pixel pitch displays.  Considering that as pixel pitch declines (more pixels/in), the cost of production increases, there is a ‘happy point’ where the consumer sees a uniform image but is not paying the cost of a smaller pixel pitch that serves no purpose.
But what about VR/AR displays?  If any of those rules are used, the pixel pitch of a display that is essentially 0” from your eye would have to have to be microscopic.  Doing a calculation for a VR headset like the HTC Vive Flow, the pixel pitch would be 0.01mm (~10um), 2,262 pixels/in, or 5.12m pixels for a 1” display.  That’s a lot of pixels in a very small space, which makes the fabrication of such displays a far more complex task than producing displays typically used for most CE devices, but pixel pitch and pixel density are only two of the multitude of factors that go into the ability of a VR headset to accurately portray a realistic image, and a deficiency in almost any of these factors can cause the motion sickness and fatigue problems that plague many potential VR users.
Much research on the root of motion sickness derived from VR comes from US Military studies that looked for reasoning behind the motion sickness that affected many that used flight simulators, particularly those for helicopters.  Given that it cost taxpayers $1.1m in 2004 ($1.62m in today’s dollars) to train a pilot, with the cost of simulator training vs. that of a live aircraft being a 1:40 ratio, there was considerable incentive to determine the cause of the problems that many faced during simulator training.  Medications were studied with some minor success, but all had side effects that would prevent their use in such situations.
In order for one to perceive motion, there are two visual systems that must work together.  The ambient system is used to detect large objects and visual flow in a user’s periphery.  The flow of information from this system increases with velocity, detail, and the nearness to the ground, so flying above the clouds in VR provides less information to the ambient visual system than it would if the user were running across a VR field.  This behooves the Metaverse designer to maximize detail in order to give the ambient visual system enough data to understand the environment.
The second component is the focal system, which is used for fine detail, size, shape consistency, and perspective, but both should be able to provide information that is consistent with what the user’s brain considers ‘normal’, so when information from either system is inconsistent with the other or with norms, problems occur and are not limited to those who have experienced motion sickness on forms of transportation.  Typical motion sickness, with ~30% of study participants experiencing seasickness in moderate seas and as high as 90% in rough seas, shows little correlation to VR issues, but at least in reference to physically caused motion sickness, continued exposure to the stimuli that caused the distress lessens the symptoms and severity over time, although it has been seen that when Navy crewmen are transferred from one type of ship to another, many show motion sickness problems until they adapt to the new environment.
One salient point that also appears in the data is that motion sickness of any kind decreases with age, which is counterintuitive for the Gen Z set, who always say, “I grew up with video games, VR won’t make me sick”.  Data collected during WWII showed that soldiers aged 17 to 19 reported seasickness at a 31% rate and those between 30 and 40 saw that drop to13%, but that same study also said that motion sickness of any kind is ‘very rare’ beyond age 50, which to anyone who has gone deep sea fishing on a choppy and cloudy day, knows is not correct.
While most VR brands focus on optics, there is another part of perception that is also a factor in motion sickness or fatigue in the VR space, and that is the vestibular system, a series of canals and organs that reside in the inner ear.  The canals give the brain information about angular velocity, particularly the rate of change, acting like a bubble on a level, and the inner ear organs measure the force of gravity and linear acceleration, all of which creates a system for maintaining balance and equilibrium, and while those born without those organs are still able to compensate with other senses, they do not experience motion sickness at all.  As the above organs are dependent on gravity for orientation, they work well in a normal environment, but are easily confused by rapid acceleration and a zero gravity environment, giving meaning to the name ‘Vomit Comet’ applied to aircraft that can create a short zero-gravity training setting during rapid directional changes.  VR environments that have no gravity reference present conflicting information to the vestibular system that is perceiving normal gravity and little or no acceleration.
All in there are many factors that need to be addressed before we become a society that can live in virtual worlds for extended periods.  We have barely touched on other issues facing micro-displays, including Field of View, Motion Tracking and Resolution, all of which must improve to make the virtual world a ‘reality’.  Of course, companies involved will spin a Metaverse story that is already happening, but we still have a lot of ground to cover before you can slip on a VR headset and spend hours floating through the rings of Saturn or playing golf with Phil Mickelson on a course you designed last weekend on an island off the coast of Australia..
.
Picture
Vestibular System - Source: Healthjade.com
Picture
Is this your course?
0 Comments

BOE – Another Celebration

12/29/2021

0 Comments


BOE – Another Celebration

​On December 28, BOE officially began mass production at its Gen 6 OLED fab in Chongqing, a fab that will eventually be capable of producing 48,000 Gen 6 sheets/month.  The fab, which is operating a 16,000 phase 1 line currently and constructing phase 2 and phase 3 lines which are expected to be opening in 2022, cost ~$7.3b to build and will help BOE compete against both Samsung Display and LG Display for Apple’s (AAPL) iPhone display business going forward.  While the local press says that phase 2 production will start in January, and BOE will increase shipments to 80m units next year, we expect mass production, based on a more conservative ramp to see an incremental 27m units from Chongqing in 2022, but we note that is at 100% yield, which we expect is far different than what is seen currently and what will be the case as the new Chongqing lines ramp up. 
On 11/08/21 we noted a more muted party at BOE, celebrating the company’s official inclusion into Apple’s iPhone display supply chain, something that had presented a number of challenges to the company since 2020.  When all three phases of the Chongqing fab are in operation and the even newer Gen 6 flexible OLED fab in Fuzhou is completed, BOE will have a combined Gen 6 capacity of 144,000 sheets/month, second only to Samsung Display, who remains the leader in the flexible OLED space, roughly double the capacity of LG Display’s small panel flexible OLED capacity and four times the flexible OLED capacity of any other Chinese small panel OLED producer.
0 Comments

Panel Pricing – 2021 Summary+

12/23/2021

0 Comments


Panel Pricing – 2021 Summary+
​

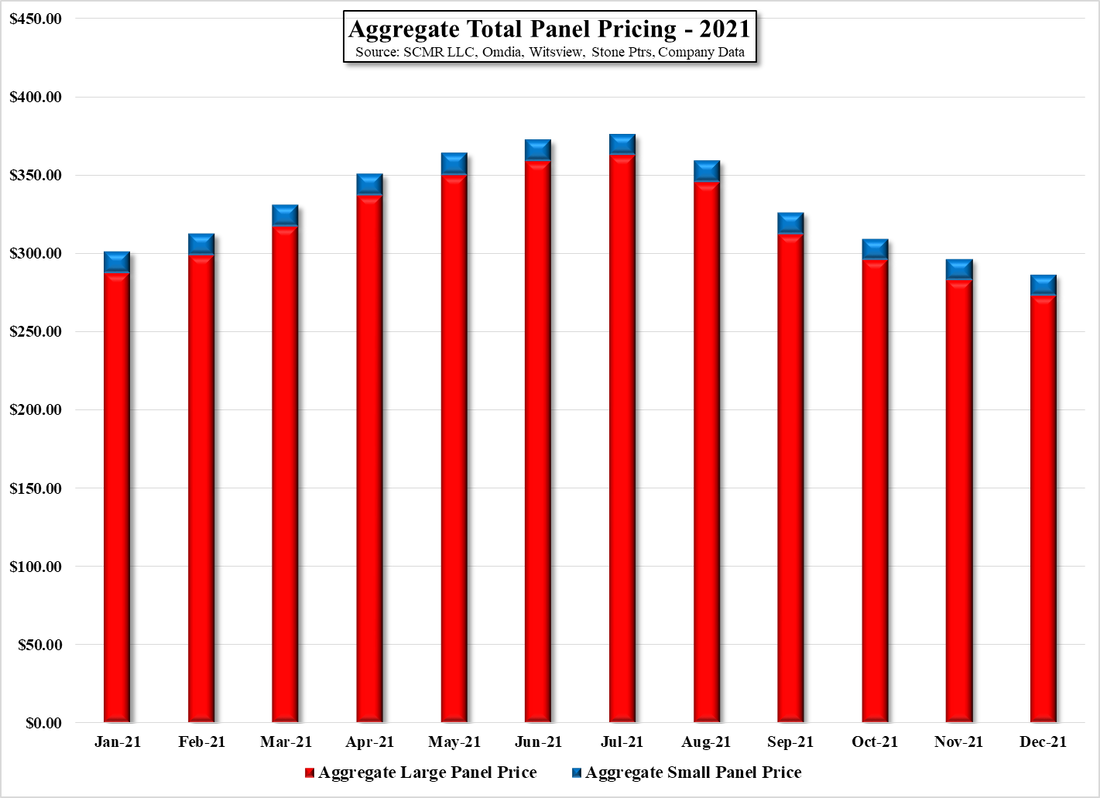
​Overall aggregate panel prices declined 4.4% in December, with large panel prices down 4.4% and small panel prices flat.  TV panel prices dropped 8.1%, more than our -6.7% expectations, while IT panel prices dropped 2.0%, with monitors and notebooks falling more than expected and tablets in line with expectations.   For the full year 2021, monitor panel prices increased by 36.3% and finished the year 4.6% off of the high (September), while notebook panel pricing finished 2021 up 23.5%, only 2.0% off of the high (also September), while TV panels saw the opposite, declining 28.0% for the year, finishing down 45.3% from the high (July) and at the low for the year.  Tablet panel pricing was up 3.2% for the year and down 9.3% from its high (July/August) and mobile panel prices were down 0.5% for the year and down 5.2% from the high, which was reached a number of times during the year. 
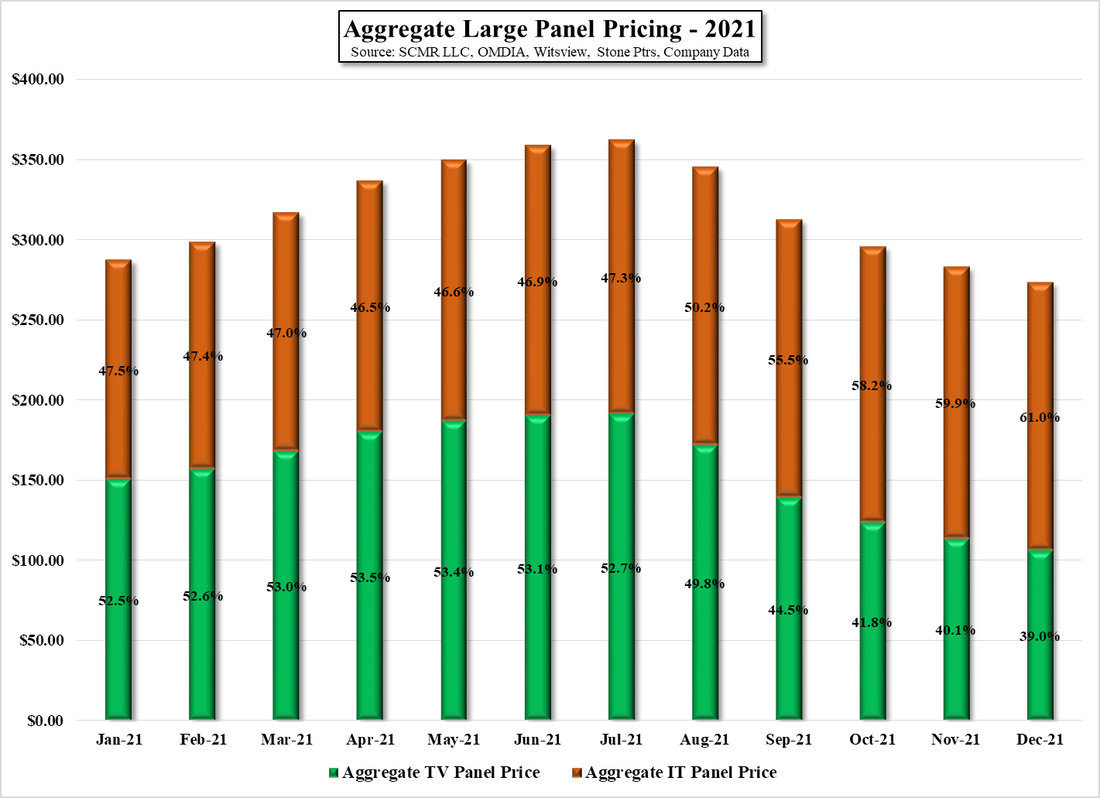
Aggregate large panel prices, which include all categories other than mobile, declined 2.2% for the year, down 25.4% from the peak, but much of that decline is from TV panels, which ended the year representing 38.6% of aggregate large panel prices, although the average share for TV panel prices was 48.8% for the full 2021 year, pointing to the steep drop for prices in that category.  Our expectations for January are for a ~3.0% decline in large panel prices, led by a 5.5% decline in TV panel prices, a 1.9% drop in monitor panel prices, a 1.0% drop in notebook prices, and a 1.7% drop in tablet panel prices.  Utilization rates will likely drop in January/February, both for yearly maintenance and the Chinese New Year holiday (Feb. 1), while component shortages continue.  This colors our expectations for January a bit as supply is reduced but demand has also diminished. 
TV panel pricing is now only 18.0% from the 3 year low, which puts significant pressure on TV panel produces to maintain TV panel pricing before it reaches cash cost levels, and we expect the shift from TV panel production to IT panel production to continue into 2022.  Thus far those reductions have done little to keep TV panel prices from falling and new large panel LCD capacity at Chinese panel producers will likely be oriented toward IT panel production, so there is a point at which TV panel prices will stabilize, but a continuation of the shift to IT panel production will then carry an increasing risk of competitive panel pricing, which could erode panel profitability without increasing IT demand.  There are pockets of increasing demand in the IT space, such as enterprise notebooks, but much of that demand was driven by expectations of a return to the workplace for many employees.  With the outbreak of the Omicron COVID variant, those plans seem to be shifting away from a return to full-time office work for many businesses.
Picture
Picture
Picture
Aggregate Monitor Panel Pricing & ROC - 2019 - 2021 - Source: SCMR LLC, IHS, Company Data
Picture
Aggregate Notebook Panel Pricing & ROC - 2019 - 2021 - Source: SCMR LLC, IHS, Witsview, Company Data
Picture
Aggregate TV Panel Pricing & ROC - 2019 - 2021 - Source: SCMR LLC, IHS, Company Data
Picture
Aggregate Tablet Panel Pricing & ROC - 2019 -2021 - Source: SCMR LLC, IHS, Company Data
Picture
Aggregate Mobile Panel Pricing & ROC - 2019 - 2021 - Source: SCMR LLC, IHS, Witsview
0 Comments

India Wants In Again

12/16/2021

0 Comments


India Wants In Again
​

​In our note of 6/25/21, we indicated India’s desire to become a producer of LCD panels based on the development of a local fab.  We noted that in 2015 the Indian government was said to have contacted a number of LCD panel producers under the auspices the 2014 “Made in India” plan, trying to convince them to build LCD panel production fabs in the country.  Panel producers however were not convinced that the country could support a local panel fab and such a project was never developed.  India has had better luck with CE assembly, having attracted Foxconn (2354.TT) and a number of component suppliers to build out facilities by providing cash incentives and tax breaks, but politics, a low-productivity workforce, and a lack of stable resources and infrastructure, have kept display producers from building local panel fabs, despite the growing local demand.
It seems that India is trying again, this time also trying to attract semiconductor foundries to build out production fabs on the sub-continent.  This week the Indian government approved a project that will invest ~$30.2b US to create an Indian semiconductor and display that will support two greenfield semiconductor fabs and two display fabs, with about 33% of the funds going toward a co-funding arrangement for those fabs.   The remaining capital allocation will be divided between developing large scale electronics and hardware manufacturing clusters (24%) and battery, solar panel, and white goods production centers. (43%).
Companies that are involved in compound semiconductor production , silicon photonics, and sensor manufacturing will be eligible for up to 30% of their capital expenditures, while IC design companies will receive up to 50% of their expenditures, based on sales volume, with the government creating a ‘semiconductor mission’ to oversee the ecosystem, which will include global experts in order to smooth the implementation of such projects.
While this all sounds like a solid plan, India has yet to show panel producers (and less likely semiconductor producers) that it can actually provide the massive infrastructure that would be needed to support either industries.  Aside from the need for a skilled workforce, reliable water, power, and transportation sources are an about necessity for such multi-billion dollar commitments, but the real problem is still the chicken-and-egg situation around supporting suppliers that are key parts of the semiconductor or display fabs themselves.  For display producers, glass substrate suppliers tend to be close by or co-located on fab grounds and fluorine production is also an on-site requirement for an efficient display fab and semiconductor fabs rely on similar gas or chemical resources to maintain continuous production.  The establishment of these key industries is a primary part of setting the path toward convincing either company type to establish a production base in the country and India has yet to prove they can do so and the competition from other regions who have well-established infrastructure makes it an exceedingly difficult task.
0 Comments

Taiwan Panel Producers – November

12/13/2021

0 Comments


Taiwan Panel Producers – November
​

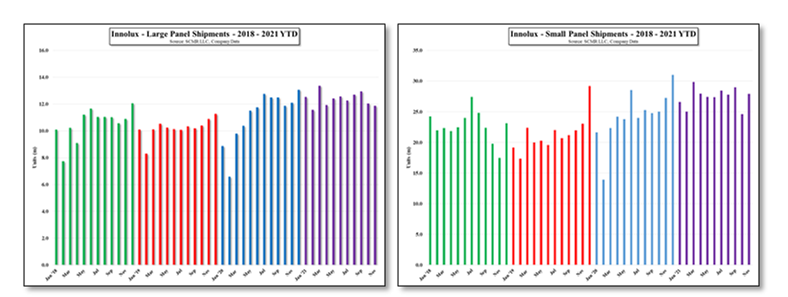
While Hannstar (6116.TT) has yet to release its November sales report, AU Optronics (2409.TT) and Innolux (3481.TT) reported mixed results for November.  AU Optronics reported sales of NT$ 30..88b ($26.14m US), up 1.6% m/m and up 19.0% y/y.  AUO no longer reports large or small panel shipments on a monthly basis.   Typically November is flat to up slightly m/m, so AUO performed well relative to its 5 year averages.  Innolux reported sales of NT$ 26.59b ($22.51M US), down 0.8% m/m and up 1.9% y/y. Large Panel shipments were 11.88m units, down 1.4% m/m and down 1.8% y/y, while small panel shipments were 27.93m units, up 13.6% m/m and up 2.5% y/y.  To characterize November for these two panel producers, we would say the month was a bit above the norm, but by a small amount. 
With declining sales across the panel space each month since August, some bounce could be expected but we presume that the general trend of declining large panel prices and weakening IT panel prices continues, although year-end orders might obscure that trend a bit.  December tends to be a volatile month for panel producers, with the 5 year average being down 2.5%, but 2020 saw a 3.3% industry sales gain in December after many years of December monthly declines, so our faith in the averages is a bit diminished. 
That said, assuming a flat December, AUO’s full year sales will be up 36.5%, with 48.3% of sales in 1H and 51.7% of sales in 2H, not far from the 5 year average split of 47.9% and 52.1%.  As TV panel prices have fallen faster than IT panel prices, AUO’s shift away from TV panel production and more toward IT panel production has helped to stave off the effects of the rapid TV panel price declines.  While we certainly give management the credit for such foresight, we expect some of that transition was also a result of the increasing pressure on AUO’s TV panel business from Chinese suppliers, who have continued to add capacity and dominate the space in terms of unit volume.
Innolux has been a bit more oriented toward large panel production, which has affected 2H sales a bit more than AUO.   2H share of the full year sales total was 49.4% vs. Innolux’s 5 year average of 53.1%, showing the effects of the more pronounced drop in TV panel prices in 2H.  The full year for Innolux was still up 29.71% (assuming a flat December) but monthly y/y comparisons are getting more difficult, just barely keeping pace with last year, while Innolux faces the same competitive issues from Chinese panel producers as does AUO.
Picture
AU Optronics - Monthly Sales - 2018 - 2021 YTD - Source: SCMR LLC, Company Data
Picture
Innolux - Monthly Sales - 2018 - 2021 YTD - Source: SCMR LLC, Company Data
Picture
Innolux - Large & Small Panel Shipments - 2018 - 2021 YTD - Source: SCMR LLC, Company Data
Picture
Aggregate Total Panel Pricing - 2021 - Source: SCMR LLC, OMDIA, Witsview, Stone Pts., Company Data
Picture
Aggregate Large Panel Pricing - 2021 - Source: SCMR LLC, OMDIA, Witsview, Stone Pts., Company Data
0 Comments

More LCD Capacity

12/3/2021

0 Comments


More LCD Capacity
​

​TCL (000100.CH) has indicated that it has authorized the construction of a new 15b RMB ($2.35b US) Gen 6 LCD fab in Wuhan.  The new fab will be financed (see below) by the company (11b RMB to start) and the Wuhan government and we note that Samsung Display became an 11.03% shareholder in Chinastar when it sold its Suzhou fab to the company.  TCL owns ~93% of the holding company, with the Chinese government holding the rest.  The fab will be built in 2 phases, the first with a capacity of 30,000 sheets/month and a second phase of 15,000 sheets/month and will be based on IGZO rather than LTPS.   Chinastar (pvt), the display production entity owned by TCL, has only one Gen 6 LCD fab (T3), which it has indicated is running at full capacity, with most of the company’s additional LCD capacity being dedicated to large panel production on Gen 8.5 or Gen 10.5/11 fabs. 
While Chinastar also has a Gen 6 OLED fab (T4), with the shift toward IT products seen in the LCD space over the last few months, it would seem that TCL felt it would need to bolster its ability to capitalize on that change.  The project is expected to take 18 months to complete (phase 1) and will be focused on small and medium sized ‘value-added’ panels, including phones, laptops, automobile displays and VR panels, along with touch panels and Mini-LED backlighting, and while the focus seems to be on IGZO , LTPO was also mentioned in the details.  Full phase one production capacity is expected to take a total of 24 months (6 months from initial production, and phase 2 is expected to be at full production 36 months from the start of the project.
As we have noted previously, panel producers have increased their focus and dependence on IT products over the last few quarters, much of which was a result of the instability in large panel LCD display prices, which had been on a significant downtrend until late 2Q 2020, at which point they ran from near lows to peak prices reinforcing those large panel capacity projects that Chinese panel producers had been so fond off.  However the rise in large panel prices and the lack of further fiscal stimulation measures began to take its toll on large panel price in July, which encouraged panel producers to shift capacity to IT products, which have remained relatively stable in price..  While this has helped mitigate the effects of the large panel price reductions seen over the last 6 months, it also has encouraged panel producers to add IT panel capacity, such as the Chinastar project mentioned herein. 
While this certainly seems like the right path for panel producers in the short-term, it adds to the higher risk profile for panel producers that we have been espousing recently.  IT panel prices have begun to decline, albeit not at the rate seen with TV panels, but even relatively small IT panel price declines will quickly reduce panel producer margins, and the anticipation of additional IT capacity will do little to help.  Again, many panel producers look only at their ability to compete with others and not at the industry as a whole, which is a sure sign that what has been hoped to be a more stable and mature LCD display industry will remain as cyclical as it has been in the past.
0 Comments
<<Previous
Forward>>

    Author

    We publish daily notes to clients.  We archive selected notes here, please contact us at: ​[email protected] for detail or subscription information.

    Archives

    May 2025
    April 2025
    March 2025
    February 2025
    January 2025
    January 2024
    November 2023
    October 2023
    September 2023
    August 2023
    June 2023
    May 2023
    February 2023
    January 2023
    December 2022
    November 2022
    October 2022
    September 2022
    August 2022
    July 2022
    June 2022
    May 2022
    April 2022
    March 2022
    February 2022
    January 2022
    December 2021
    November 2021
    October 2021
    September 2021
    August 2021
    July 2021
    June 2021
    May 2021
    April 2021
    March 2021
    February 2021
    January 2021
    December 2020
    October 2020
    July 2020
    May 2020
    November 2019
    April 2019
    January 2019
    January 2018
    August 2017
    July 2017
    June 2017
    May 2017
    April 2017
    March 2017
    February 2017
    January 2017
    November 2016
    October 2016
    September 2016

    Categories

    All
    5G
    8K
    Aapl
    AI
    AMZN
    AR
    ASML
    Audio
    AUO
    Autonomous Engineering
    Bixby
    Boe
    China Consumer Electronics
    China - Consumer Electronics
    Chinastar
    Chromebooks
    Components
    Connected Home
    Consumer Electronics General
    Consumer Electronics - General
    Corning
    COVID
    Crypto
    Deepfake
    Deepseek
    Display Panels
    DLB
    E-Ink
    E Paper
    E-paper
    Facebook
    Facial Recognition
    Foldables
    Foxconn
    Free Space Optical Communication
    Global Foundries
    GOOG
    Hacking
    Hannstar
    Headphones
    Hisense
    HKC
    Huawei
    Idemitsu Kosan
    Igzo
    Ink Jet Printing
    Innolux
    Japan Display
    JOLED
    LEDs
    Lg Display
    Lg Electronics
    LG Innotek
    LIDAR
    Matter
    Mediatek
    Meta
    Metaverse
    Micro LED
    Micro-LED
    Micro-OLED
    Mini LED
    Misc.
    MmWave
    Monitors
    Nanosys
    NFT
    Notebooks
    Oled
    OpenAI
    QCOM
    QD/OLED
    Quantum Dots
    RFID
    Robotics
    Royole
    Samsung
    Samsung Display
    Samsung Electronics
    Sanan
    Semiconductors
    Sensors
    Sharp
    Shipping
    Smartphones
    Smart Stuff
    SNE
    Software
    Tariffs
    TCL
    Thaad
    Tianma
    TikTok
    TSM
    TV
    Universal Display
    Visionox
    VR
    Wearables
    Xiaomi

    RSS Feed

Site powered by Weebly. Managed by Bluehost